Week 1 challenge was to recreate the visualisation that helps identify the year over year purchase frequencies of Superstore data.
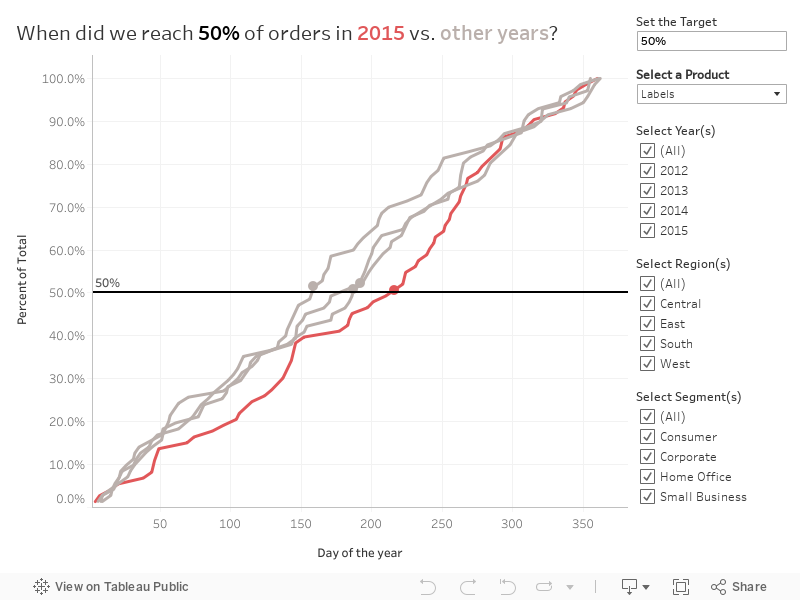
The chart is a cumulative % of total versus day of the year line chart. This chart has a line for each year and the latest year is highlighted. A percent target is user-specified and the title, reference line and dots on each line are updated based on this target value. Filters are included for Year, Region, Customer Segment, and Product Sub-Category. To view this workbook on my Tableau Public page you can click here.