
To view the powerpoint click here.
To view the SQL scripts click here.
Background on Cyclistic
- Bikeshare Company launched in 2016
- Currently has fleet of 5,824 bikes and 692 stations throughout Chicagoland
- Flexible riding plans: single-ride passes, full-day passes, and annual memberships
- Finance has determined that annual members are much more profitable than casual riders
- Director of marketing believes maximizing the number of annual members is key to future growth
- Design marketing strategies aimed at converting casual riders into annual members
Business Questions to address
- Three questions will guide the future marketing program:
- How do annual members and casual riders use Cyclistic bikes differently?
- Why would casual riders buy Cyclistic annual memberships?
- How can Cyclistic use digital media to influence casual riders to become members?
- This study will be focusing on the first task
Prepare Data for Analysis
- Obtained data made available by Motivate International Inc. at https://divvy-tripdata.s3.amazonaws.com/index.html
- Downloaded last 12 months of data from February 2023 to January 2024
- Features of the data:
- ride_id
- rideable_type(electric, docked)
- started_at
- ended_at
- start_station_name
- start_station_id
- end_station_name
- end_station_id
- start_lat
- start_lng
- end_lat
- end_lng
- member_casual
Process Data for Analysis
- Used SQL for processing the data since there’s a little over 5 million records for the one year period (SQL scripts link)
- Pulled each table and put all the tables together into one table within SQL
- Calculated ride length in minutes for each record and month, day, and year using the ride start timestamp
- Cleaning and Verification:
- Several ride length times(2.5%) were less than or equal to zero since start time was earlier then end time; these data points were removed
- Ensure that there is no NULL data for the member/casual classifiction
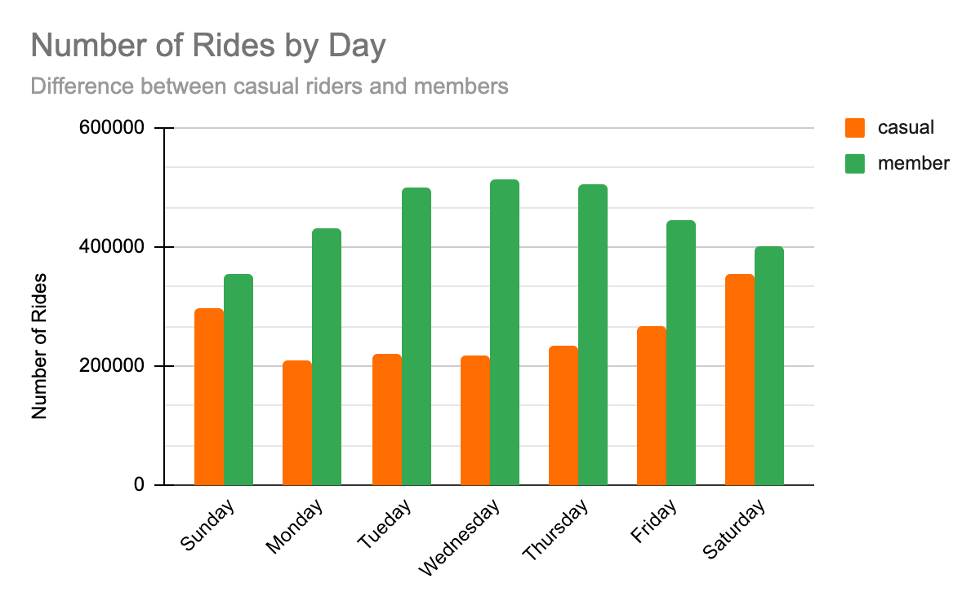
Analysis by Day of the Week
- Members ride more frequently than casual members on all days of the week (about 193k more rides)
- Difference is lesser on the weekends(52k more)
- Casual riders ride most frequently on the weekends
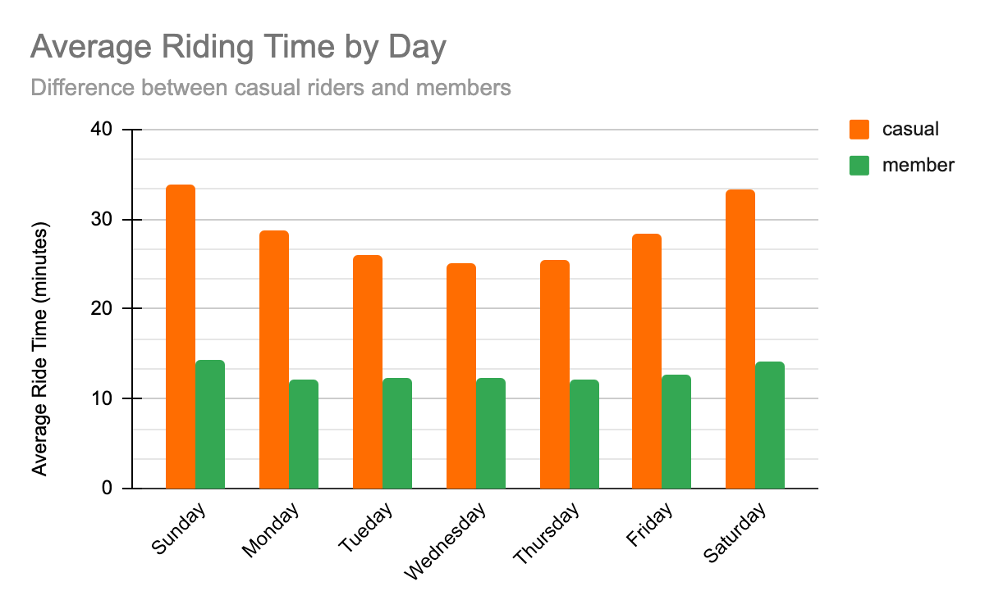
Analysis by Day of the Week
- Average riding time for casual riders is higher than members on all days of the week (16 minutes on average)
- Highest riding averages for both members and casual riders are on the weekends
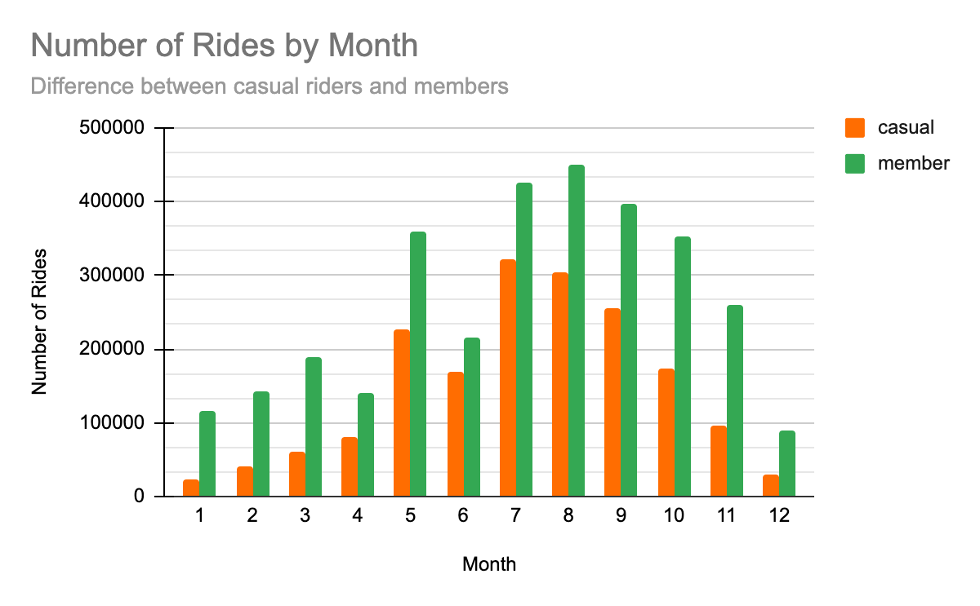
Analysis by Month
- There’s an increase in ridership of members and casual riders in the summer and fall months(Jun.-Nov.)
- There is significantly small number of rides by casual riders in the winter months (Dec.-Feb.)
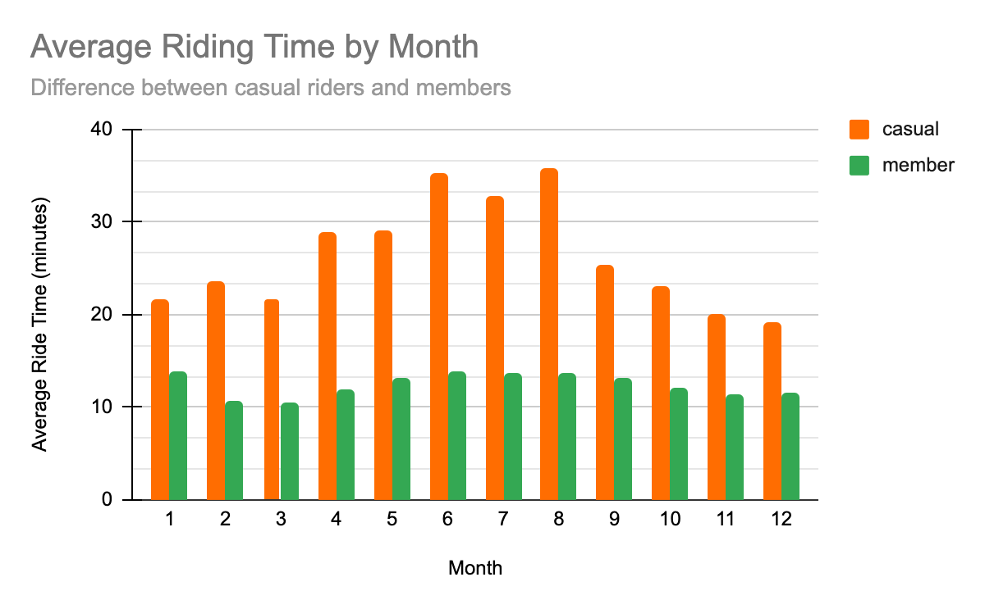
Analysis by Month
- Casual riders have a higher average ride time in the summer months (Apr.-Aug.)
- Casual riders ride approximately 14 more minutes on average longer than members
Final Analysis Recommendations
- Casual riders ride most frequently on:
- Weekends
- Summer and fall months
- Casual ride minutes do not vary significantly by day or month of the year
- Average time casual riders ride is much more than members