Introduction
- Space X advertises Falcon 9 rocket launches on its website with a cost of $62 million; other providers cost upward of $165 million each; much of the savings are because Space X can reuse the first stage
- Therefore if we can determine if the first stage will land, we can determine the cost of a launch
- This information can be used if an alternate company wants to bid against Space X for a rocket launch
- In this project, we try to predict if the first stage will land given the data we have
Methodology
- Data collection methodology:
- SpaceX API and Wikipedia page on Rocket Launches
- Perform data wrangling
- Value_counts used to examine data
- Perform exploratory data analysis (EDA) using visualization and SQL
- Perform interactive visual analytics using Folium and Plotly Dash
- Perform predictive analysis using classification models
- Machine learning algorithms compared to find best one
Data Collection
- Data was taken from two sources:
- SpaceX API
- Wikepedia web-scraping of Falcon 9 Launches
- Data collection processes using key phrases and flowcharts
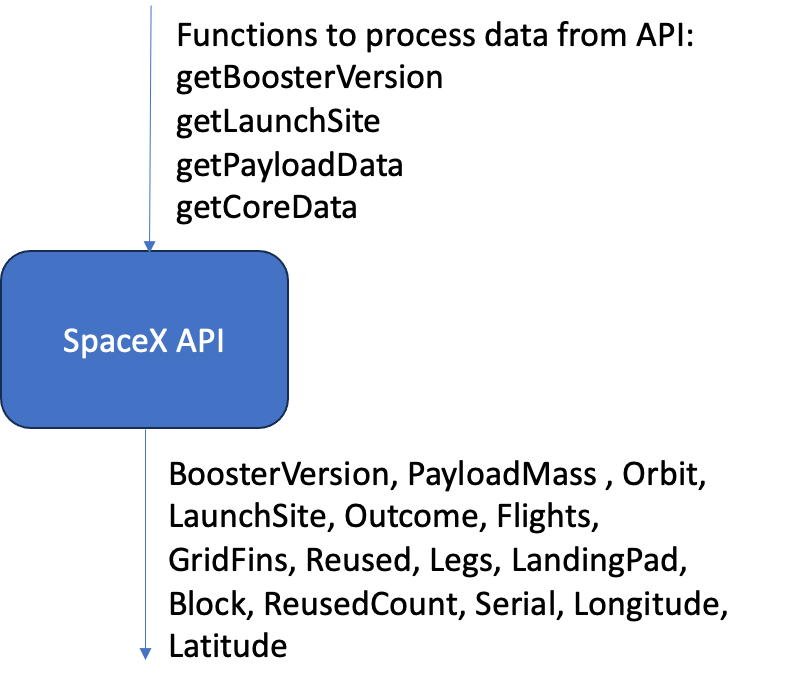
Data Collection – Space X API
GitHub URL of the completed SpaceX API calls notebook: Jupyter Notebook
- Data collection with SpaceX REST calls
- Request and Parse the Space X Launch Data Using GET request
- Import JSON file into a dataframe and used additional API calls to parse the data
- Filter data to only include Falcon 9 launches
- Payload mass had some missing values that were replaced by the mean of the known values
Data Collection – Web Scraping
GitHub URL of the completed web scraping notebook: Jupyter Notebook
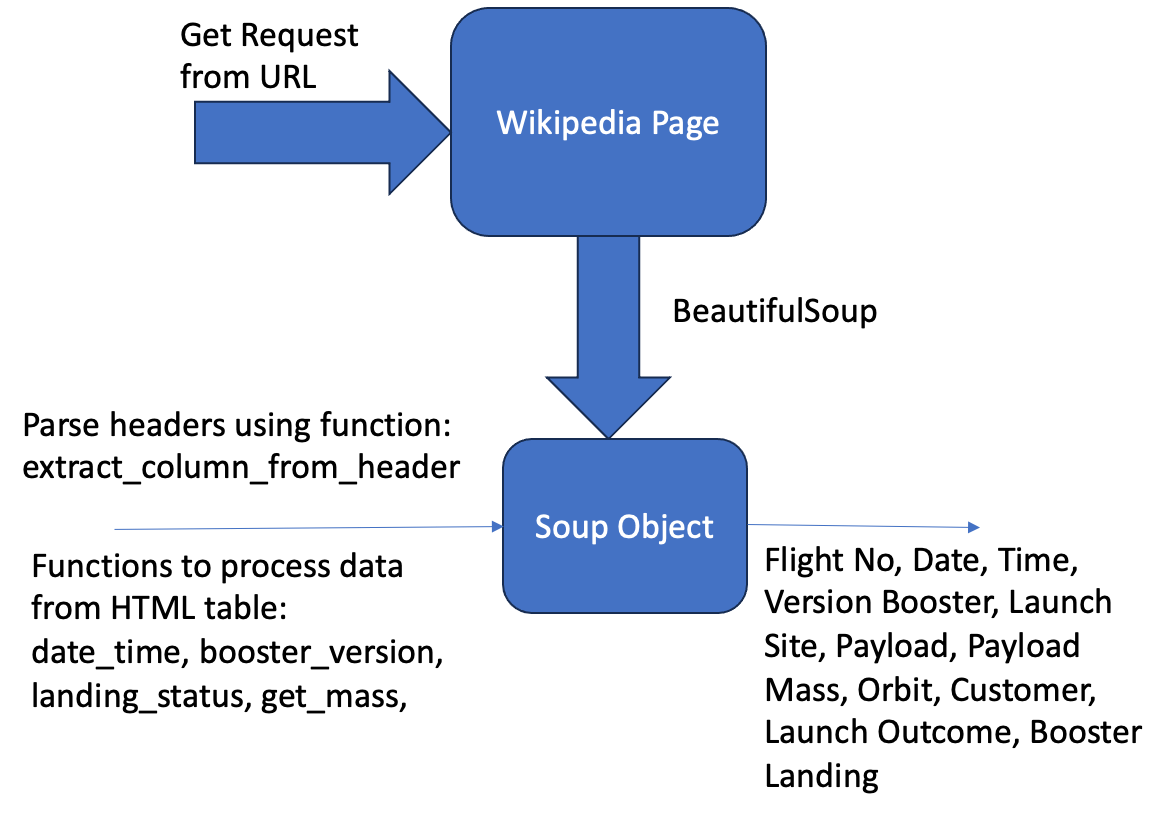
- Web scraping to collect Falcon 9 historical launch records from a Wikipedia page titled “List of Falcon 9 and Falcon Heavy launches”
Data Wrangling
GitHub URL of your completed data wrangling related notebooks: Jupyter Notebook
- Various data frame properties were analyzed to gain better understanding
- Number of launches on each site were determined using value_counts
- Number and occurrence of each orbit was determined using value_counts
- Number and occurrence of mission outcomes was determined using value_counts
- Outcomes were transformed to 0 for failed and 1 for successful and a “Class” column was added to the dataframe
EDA with Data Visualization
GitHub URL of completed EDA with data visualization notebook: Jupyter Notebook
Flight Number vs. Launch Site with Success/Fail Launch Marker
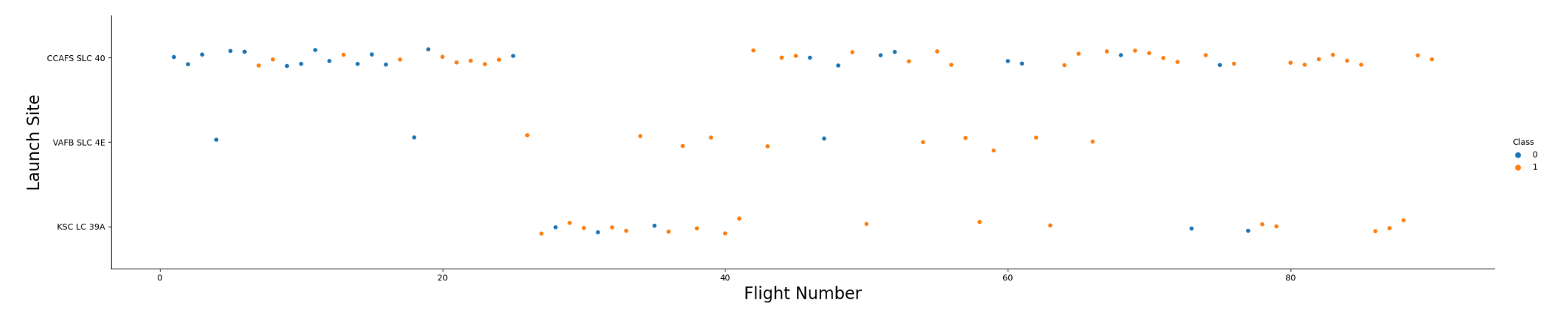
- More launches at the CCAFS site vs. others
- It appears that later flights have a lot more success than the earlier flights (0=fail, 1=success)
Payload Mass vs. Launch Site Scatter Plot with Success/Fail Class Marker
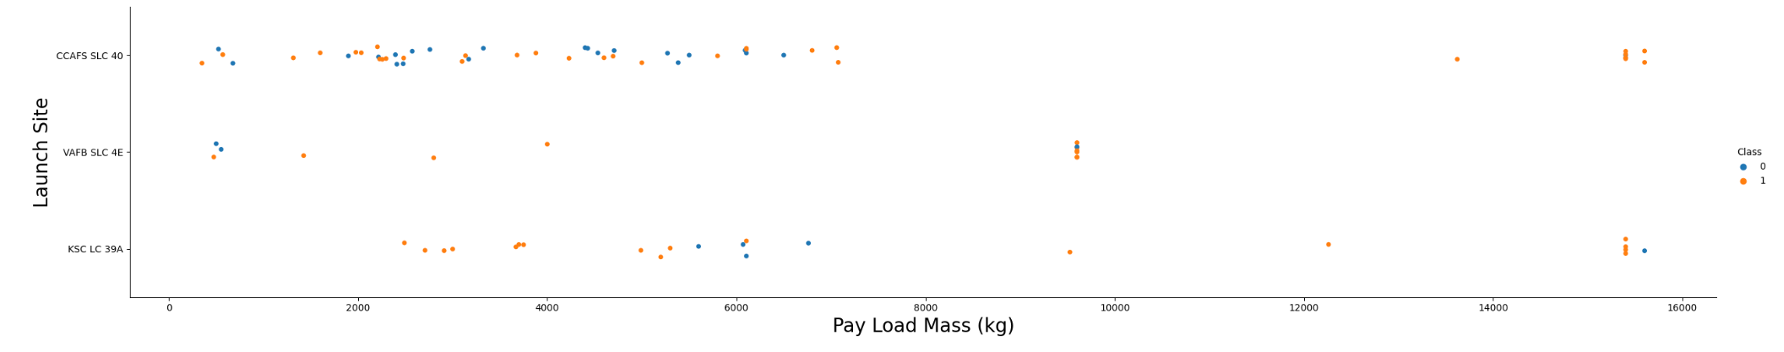
- For the VAFB-SLC launch site there are no rockets launched for heavy payload mass (greater than 10,000kg)
Relationship between Success Rate and Orbit Type using Bar Chart
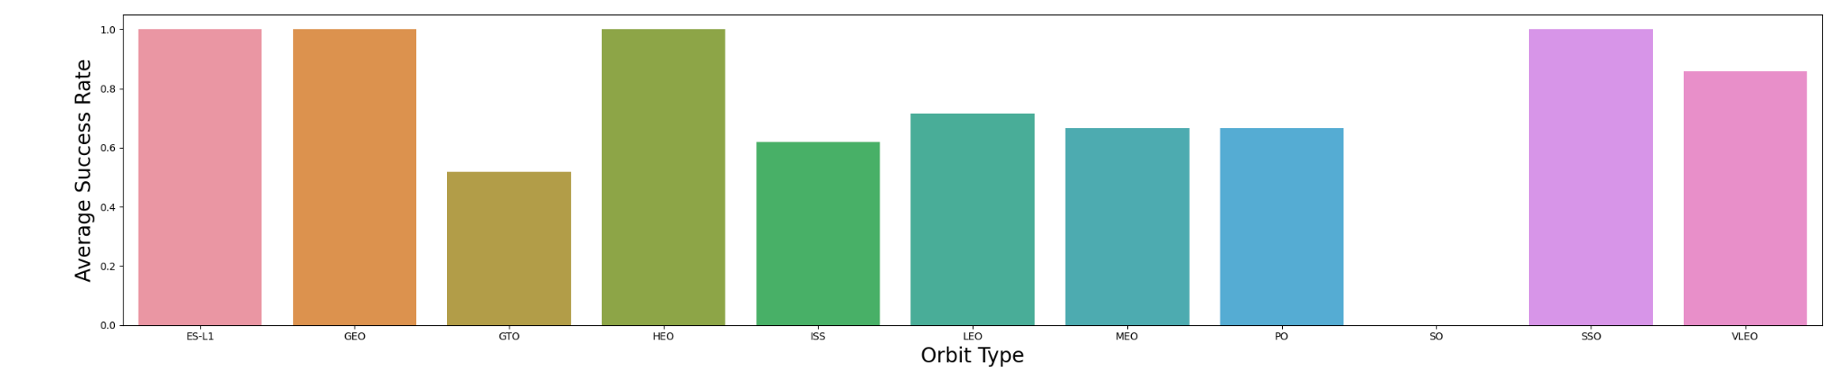
- The orbits with the highest success rates are ES-L1, GEO, HEO, and SSO
Flight Number vs. Orbit Type Scatter Plot with Success/Fail Class Marker
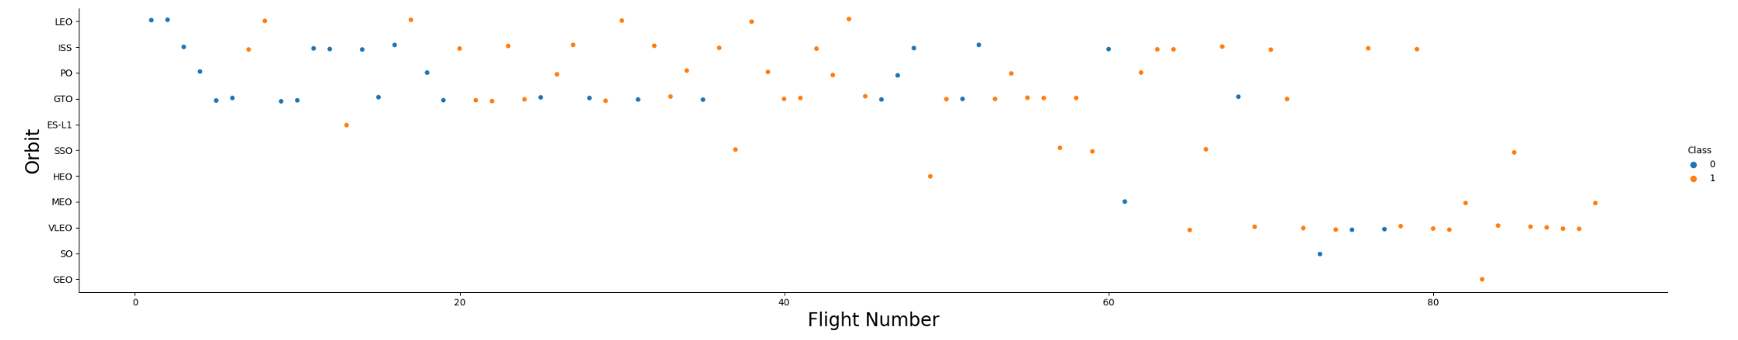
- LEO orbit success appears related to the number of flights since all the flights after the first two are successful (0=fail, 1=success)
- On the other hand, there seems to be no relationship between flight number when in GTO orbit
Payload Mass vs. Orbit Type Scatter Plot with Success/Fail Class Marker
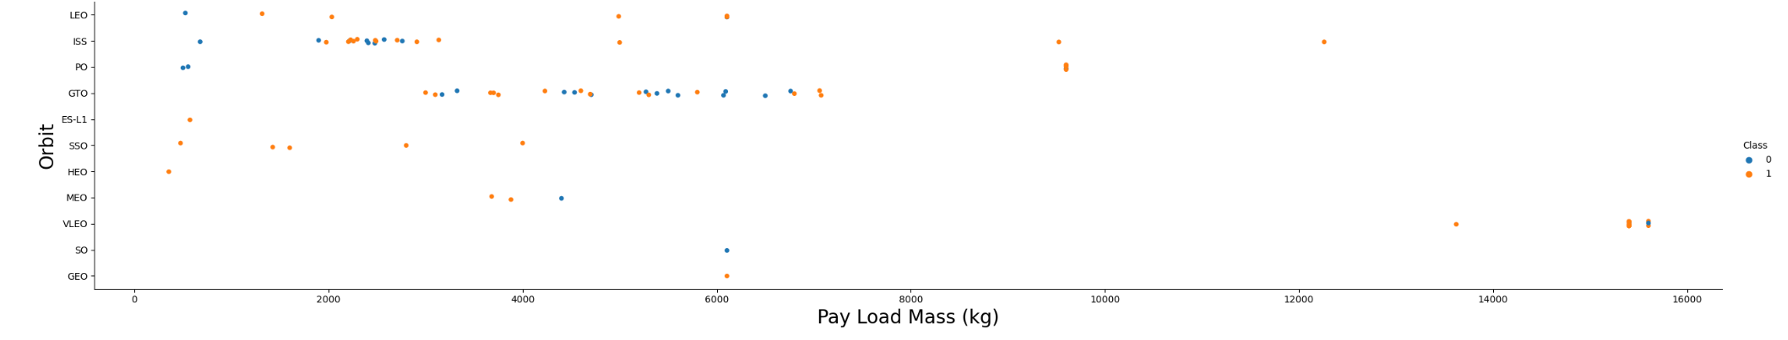
- With heavy payloads the successful landing or positive landing rate are more for Polar, LEO and ISS (0=fail, 1=success)
- However, for GTO we cannot distinguish this well as both positive landing rate and negative landing(unsuccessful mission) are both present at all pay loads
Launch Success Yearly Rate Line Chart
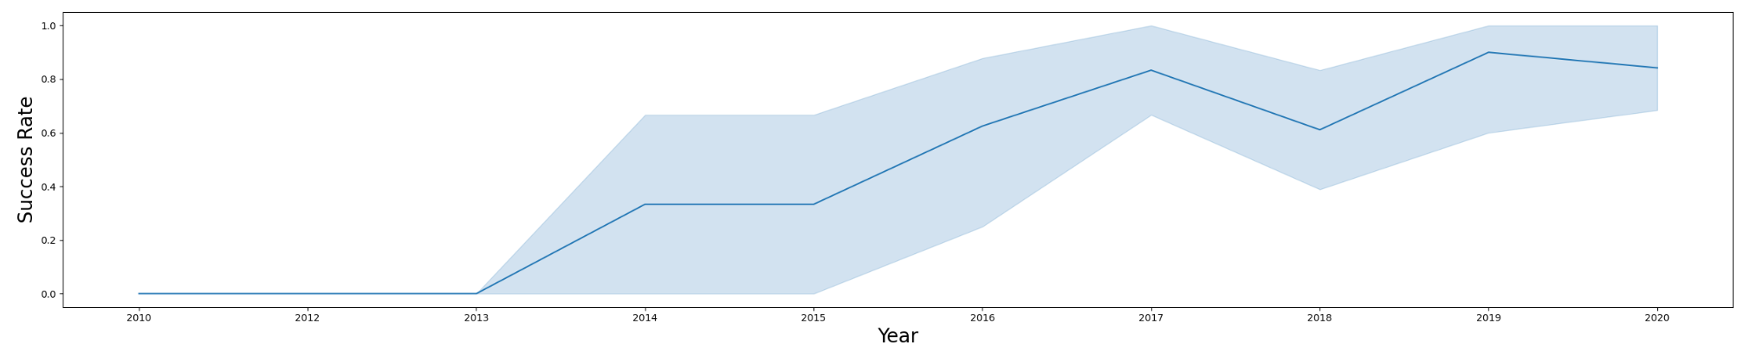
- Success rate since 2013 kept increasing steadily until 2020
EDA with SQL
GitHub URL of completed EDA with SQL notebook: Jupyter Notebook
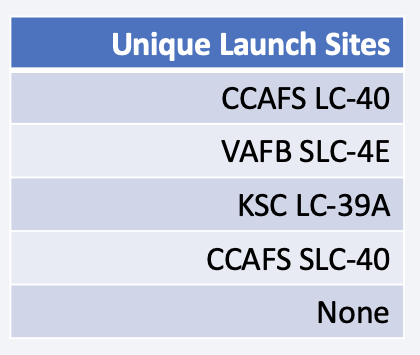
Unique Launch Sites in the Mission
- Found the names of the unique launch sites using SQL DISTINCT query
- There are 4 unique launch sites as shown below
Launch Site Names Beginning with ‘CCA’

- Found 5 records using SQL WHERE LIKE query
Total Payload Mass Carried by Boosters Launched by NASA (CRS)
- Total payload carried by boosters from NASA using SQL SUM query
- The total payload carried by booster from NASA is 45,596kg
Average Payload Mass Carried by Booster Version F9 v1.1
- Average payload mass carried by booster version F9 v1.1 using SQL AVG query
- The average payload mass for F9 v1.1 booster version is 2,534.7kg
Date When the First Successful Landing Outcome in Ground Pad was Achieved
- Dates of the first successful landing outcome on ground pad using SQL MIN query
- The first successful ground landing date is on 1/8/2018
Names of the Boosters Which have Success in Drone Ship Landing and have Payload Mass Between 4000 and 6000
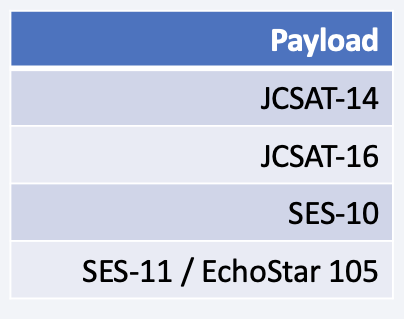
- Boosters which have successfully landed on drone ship and had payload mass greater than 4000 but less than 6000 using SQL WHERE LIKE function and conditions
- Only 4 payloads meet this payload mass criteria
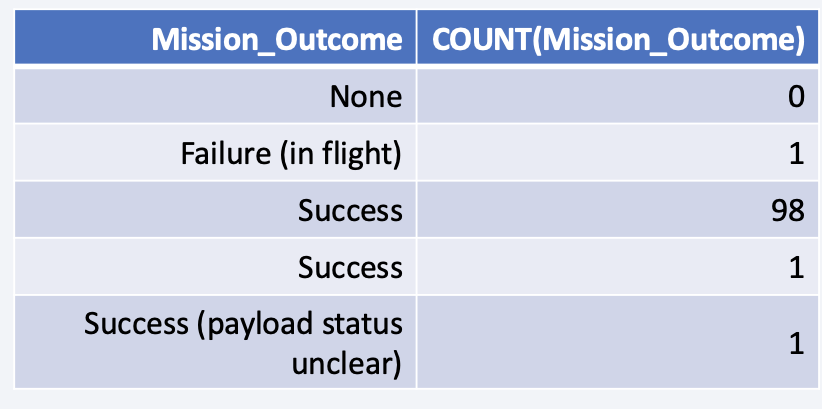
Total Number of Successful and Failure Mission Outcomes
- Total number of successful and failure mission outcomes using SQL COUNT and GROUP BY queries
- There are 100 successful missions and 1 failure
Names of the Booster_versions Which have Carried the Maximum Payload Mass
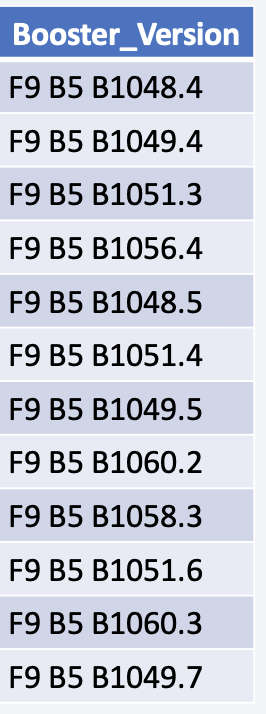
- Names of the booster which have carried the maximum payload mass using SQL Subquery and MAX function
- There are 12 booster versions that meet this criteria
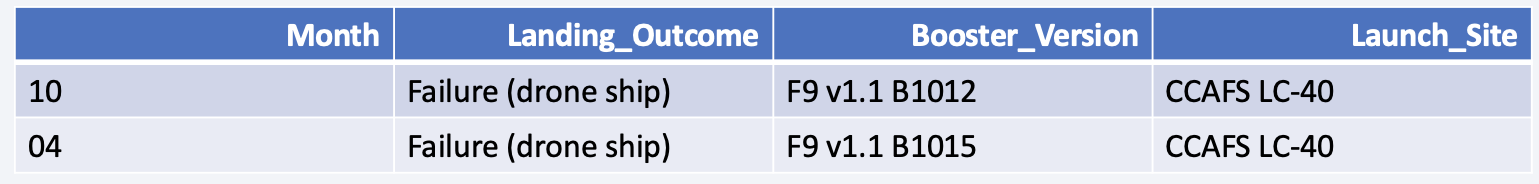
2016 Failed Launch Records
- Failed landing_outcomes in drone ship, their booster versions, and launch site names for the year 2015 using SQL query and SUBSTR to parse date
- Both of these were from CCAFS LC-40 launch site
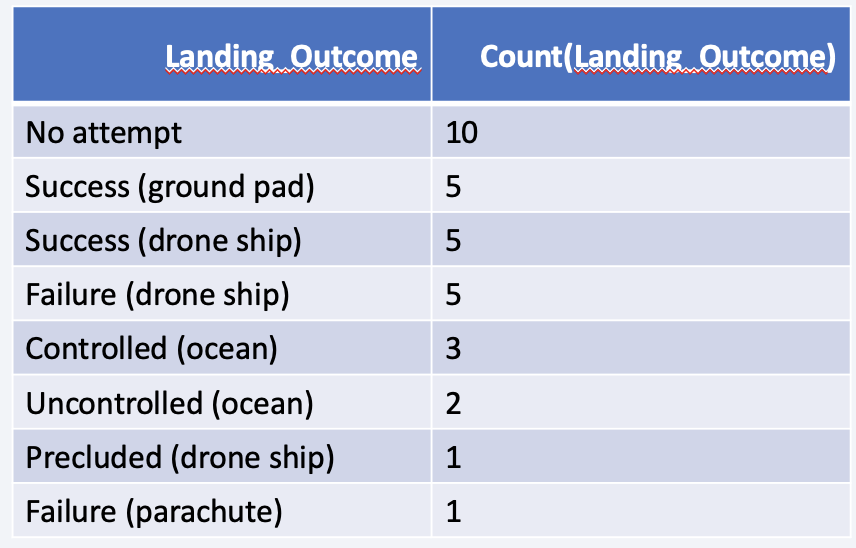
Rank Landing Outcomes Between 2010-06-04 and 2017-03-20
- Rank the count of landing outcomes (such as Failure (drone ship) or Success (ground pad)) between the date 2010-06-04 and 2017-03-20, in descending order using SQL GROUP BY query and SUBSTR to parse date
- A total of 32 landings were made during this time period
- Most of the landing outcomes were ”No attempt” and least were parachute failure and precluded drone ship
Build an Interactive Map with Folium
GitHub URL of completed interactive map with Folium map: Jupyter Notebook
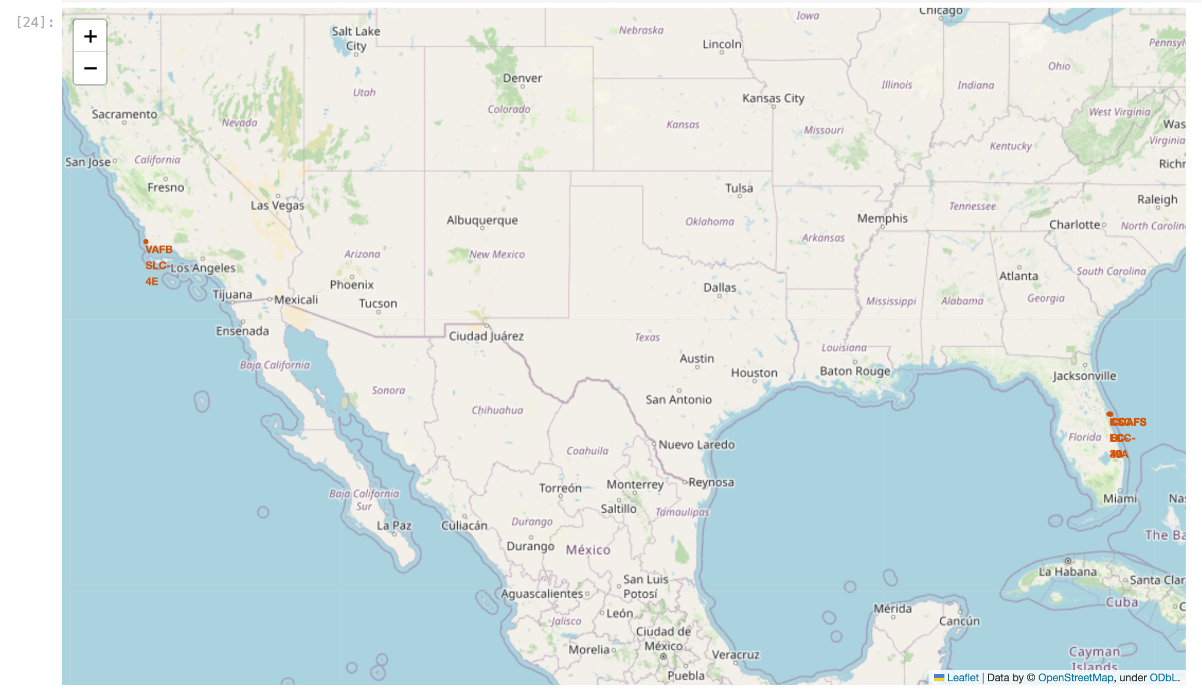
- Marked all launch sites on map with circles and used markers for labels
- Sites are located near the coastlines and several are located near each other so it’s hard to see on this map since they overlay each other
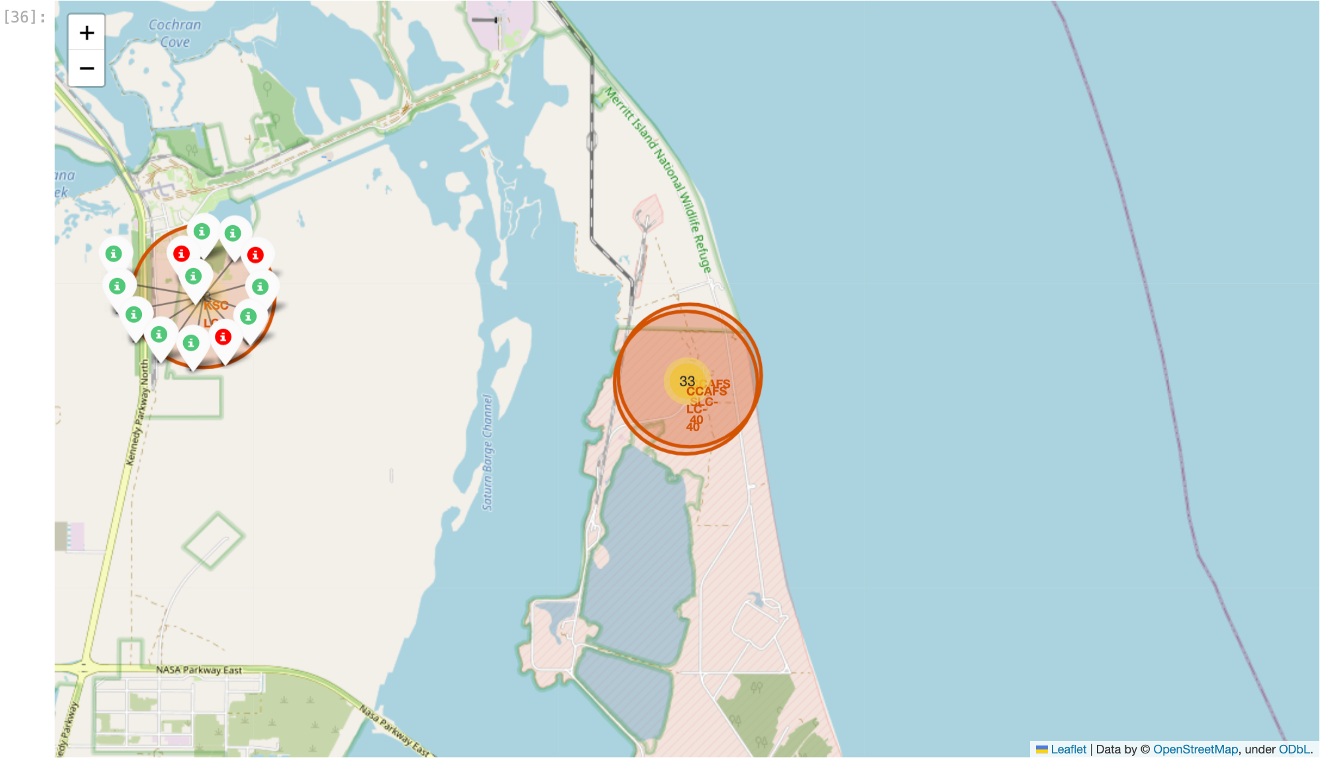
- Marked the success/failed launches for each site on the map with markers for labels
- Success were marked green and failures were marked red to help identify which launch sites have higher success rates
- Used a marker cluster since there were many launches in the same location
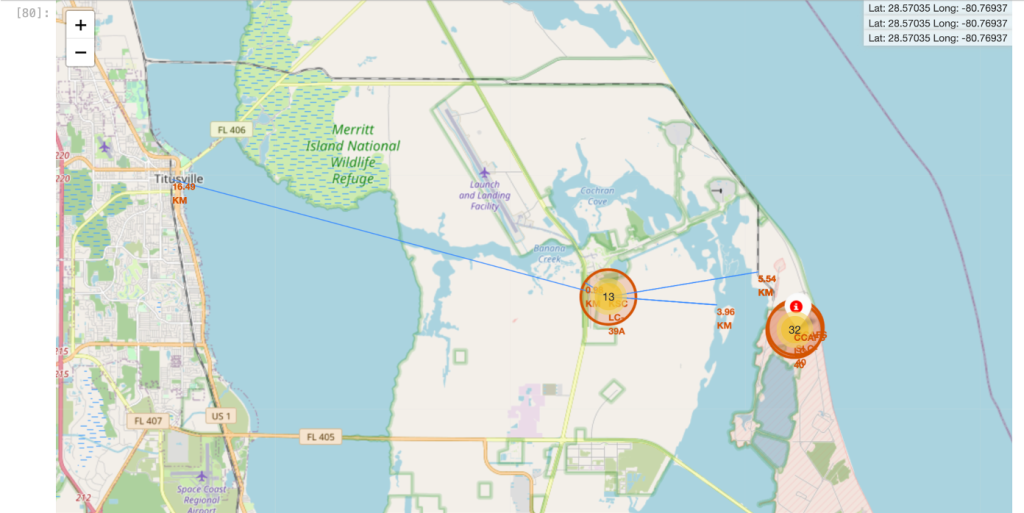
- Upon closer inspection there are three sites on the east coast, as expected.
- Most appear to be successful on this KSC LC-39A site
- Calculated the distances between a launch site to its proximities (coastline, railroad, highway, or city)
- Created polyline to each and calculated and marked distances
- KSC LC-39A launch site to its proximities such as railway, highway, coastline, with distance calculated and displayed
- The nearest highway is about 1 km, coastline about 4 km, railroad about 5.5 km and city about 16.5 km
Build a Dashboard with Plotly Dash
GitHub URL of completed Plotly Dash lab: Jupyter Notebook
- Pie chart of success rates for launch sites with a dropdown to make selection of specific launch sites
- We have four different launch sites and we would like to first see which one has the largest success count
- We would like to select one specific site and check its detailed success rate (class=0, failed vs. class=1, success)
Pie Chart of Overall Launch Success
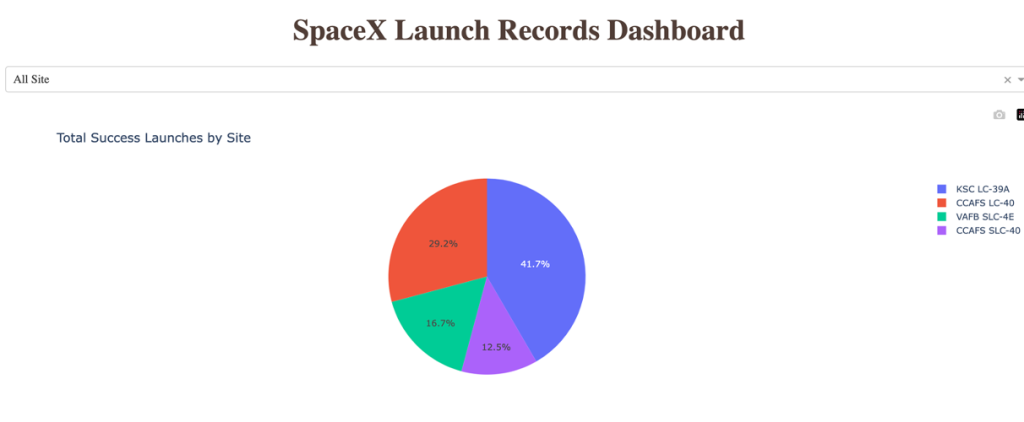
- Launch site with the highest success rate is KSC LC-39A
- Launch site with the lowest success rate is CCAFS SLC-40
Pie Chart for Launch Site with Highest Success
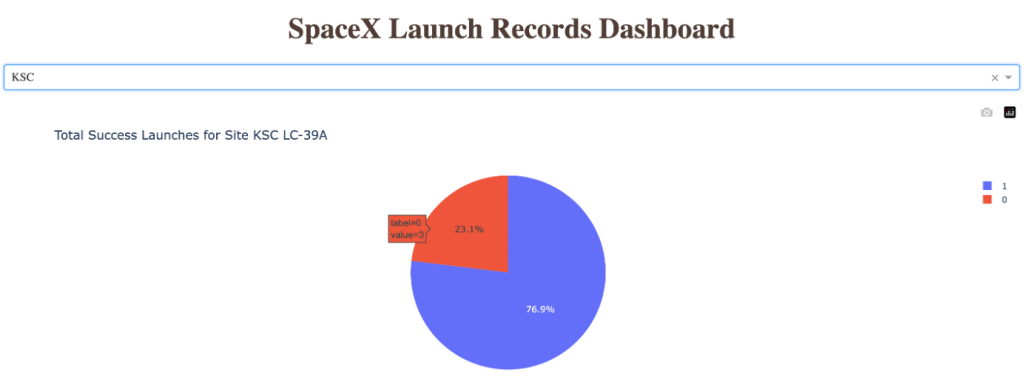
- Launch Site KSC LC-39A has the highest success ratio
Scatter plot of Payload vs. Launch Outcome
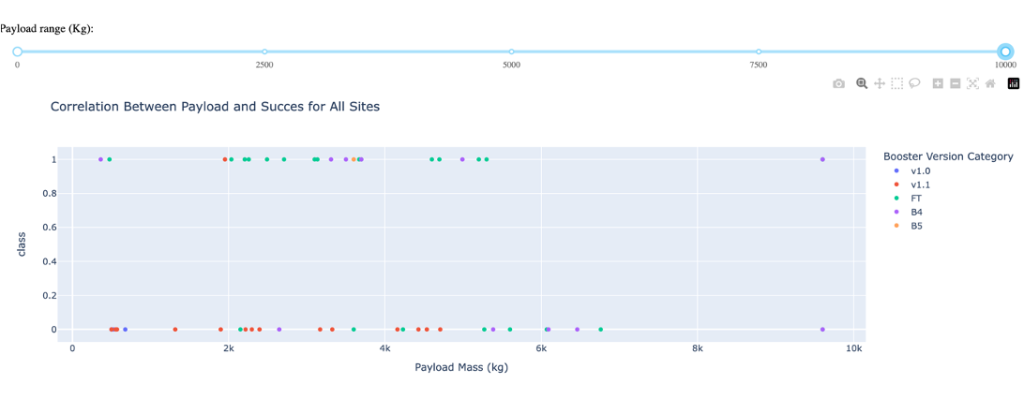
- Highest success rate is achieved by Booster version FT
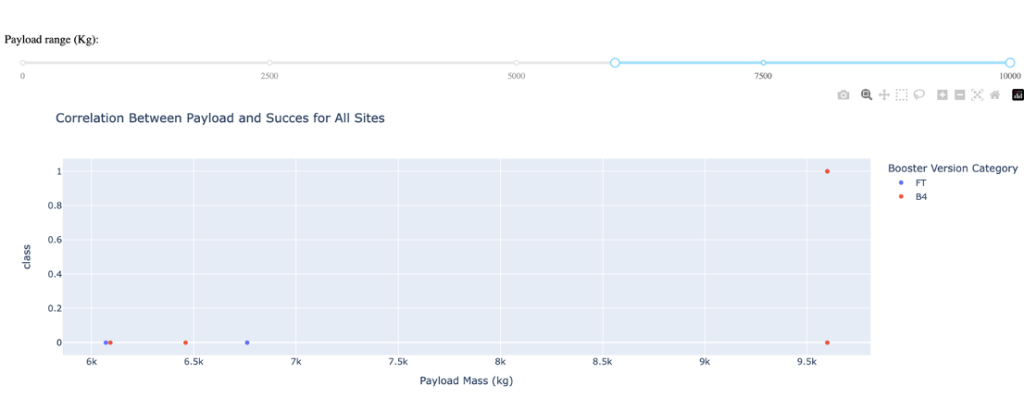
- Only Booster version FT and B4 are run at higher payloads with success only for B4
Predictive Analysis (Classification)
GitHub URL of predictive analysis lab: Jupyter Notebook
- Created a numpy array of class and called this Y
- Standardized data in X dataframe with StandardScalar()
- Created a training and test set of X and Y variables with test_size of 0.2 and random_state of 2
- Created GridSearch objects with cv=10 and created the following ML models:
- Linear Regression
- SVM
- Decision Tree
- K-Nearest Neighbor
MODEL Accuracy
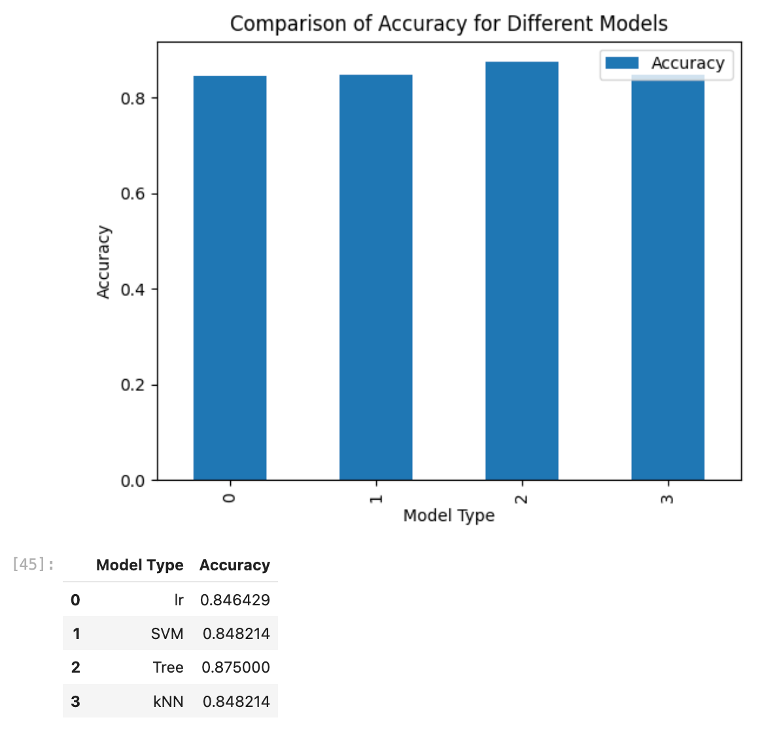
- The accuracy of all the models is very close
- The best model accuracy is achieved with the Decision Tree model
Confusion Matrix
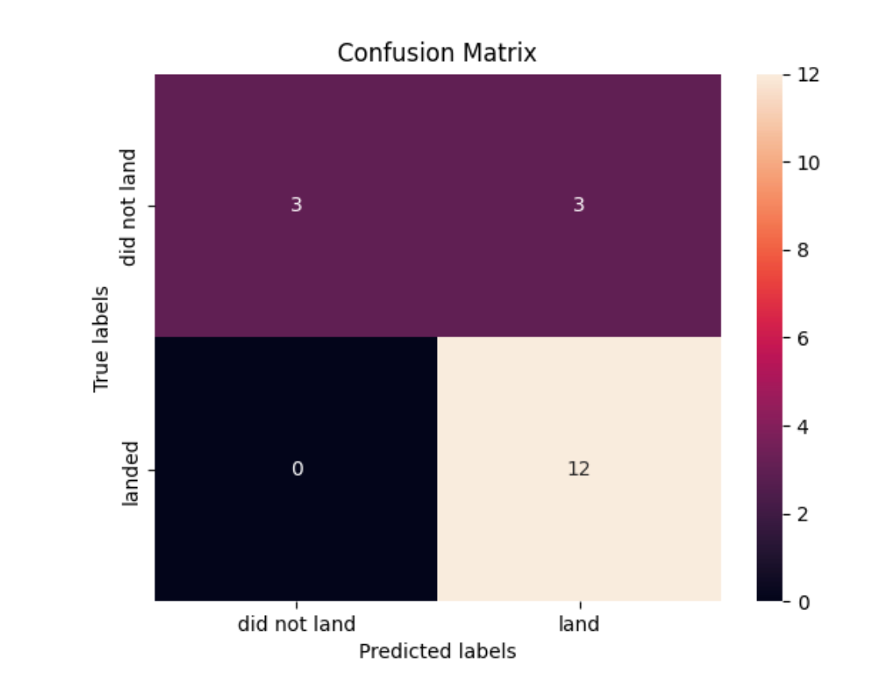
- There are no False Negatives
- There is only 3 False Positives
- There are 15 correct predictions out of 18 with majority being True Positives
Conclusions
- Launch Site KSC LC-39A has the highest success ratio
- The orbits with the highest success rates are ES-L1, GEO, HEO, and SSO.
- Launch Site KSC LC-39A proximities: nearest highway is about 1 km, coastline about 4 km, railroad about 5.5 km and city about 16.5 km
- Highest success rate is achieved by Booster version FT
- Decision Tree models are the best predictors of success